I co-developed it because those leaders are often asked to choose a fix before anyone has identified the condition behind the problem. A sales leader can change compensation, buy training, alter the hiring profile or push managers harder. HR can launch another engagement program. Each may be sensible. Each can also spend money on something that was already working.
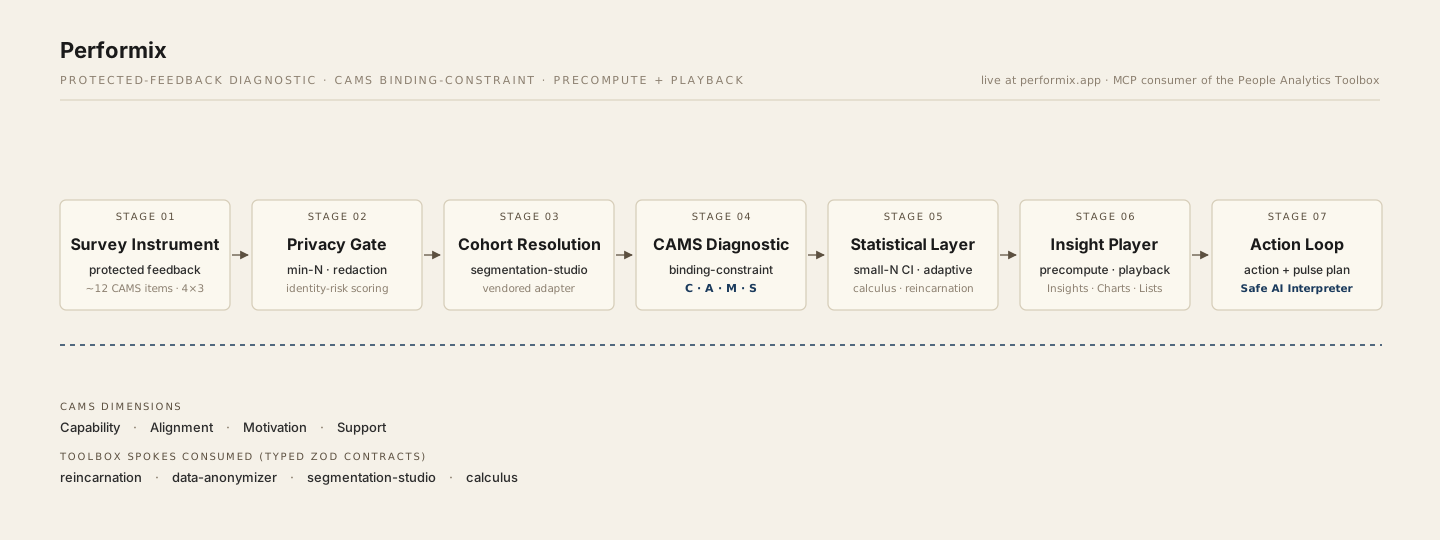
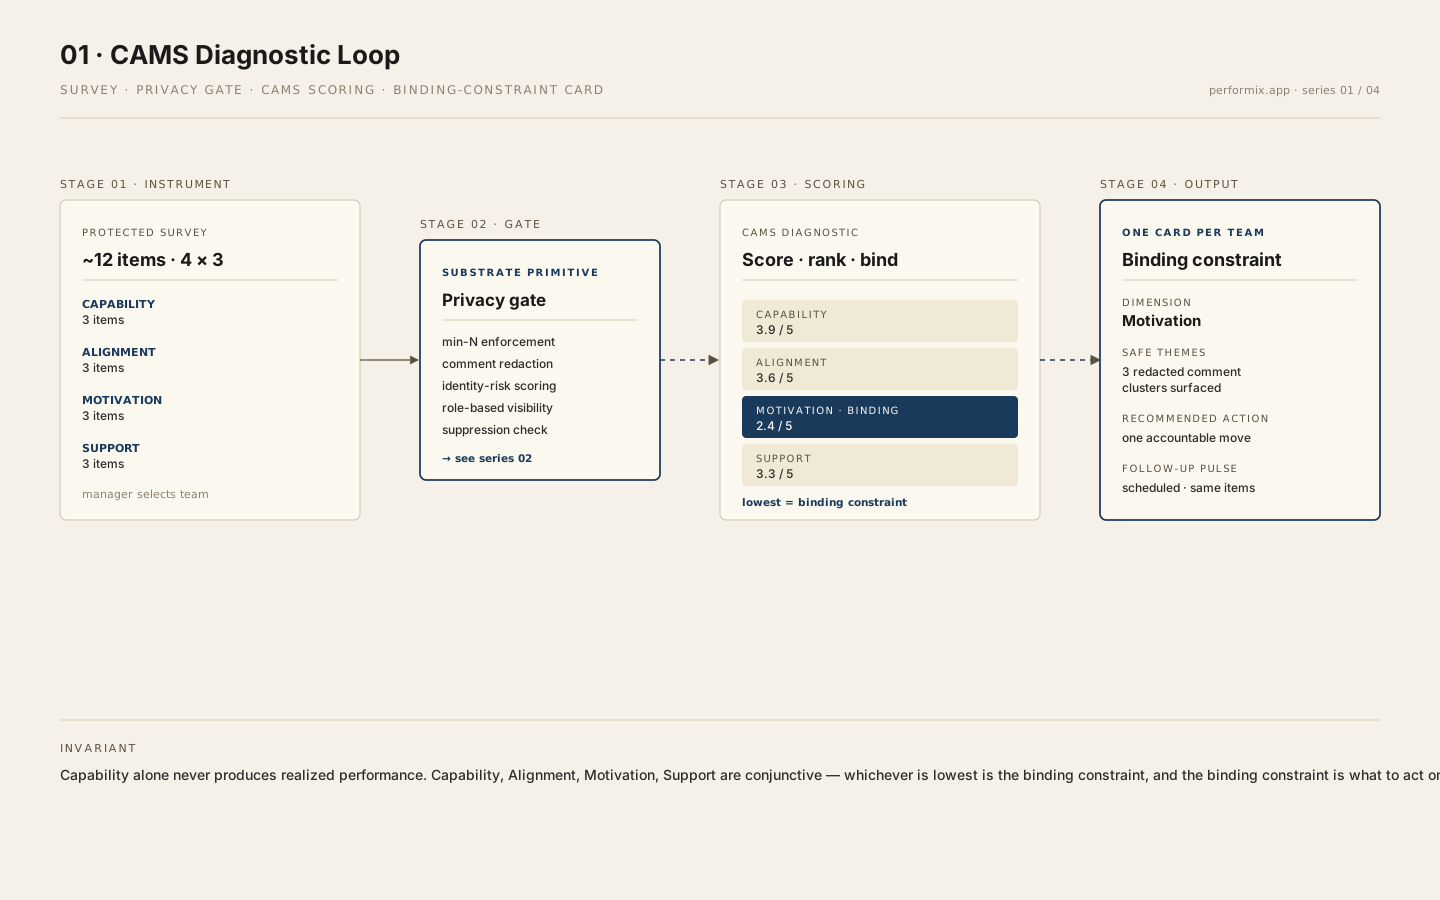
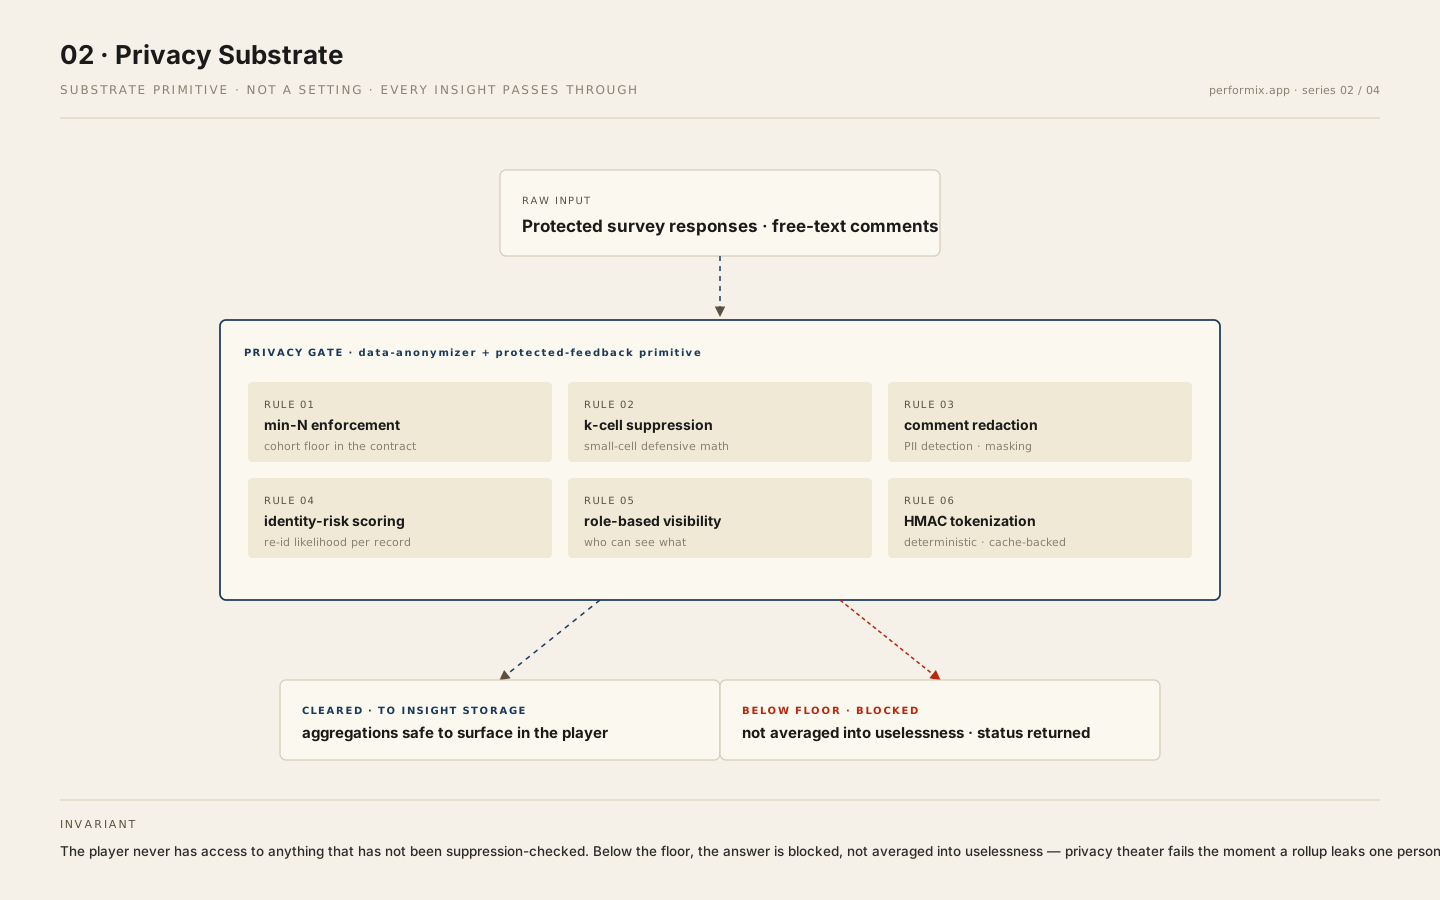
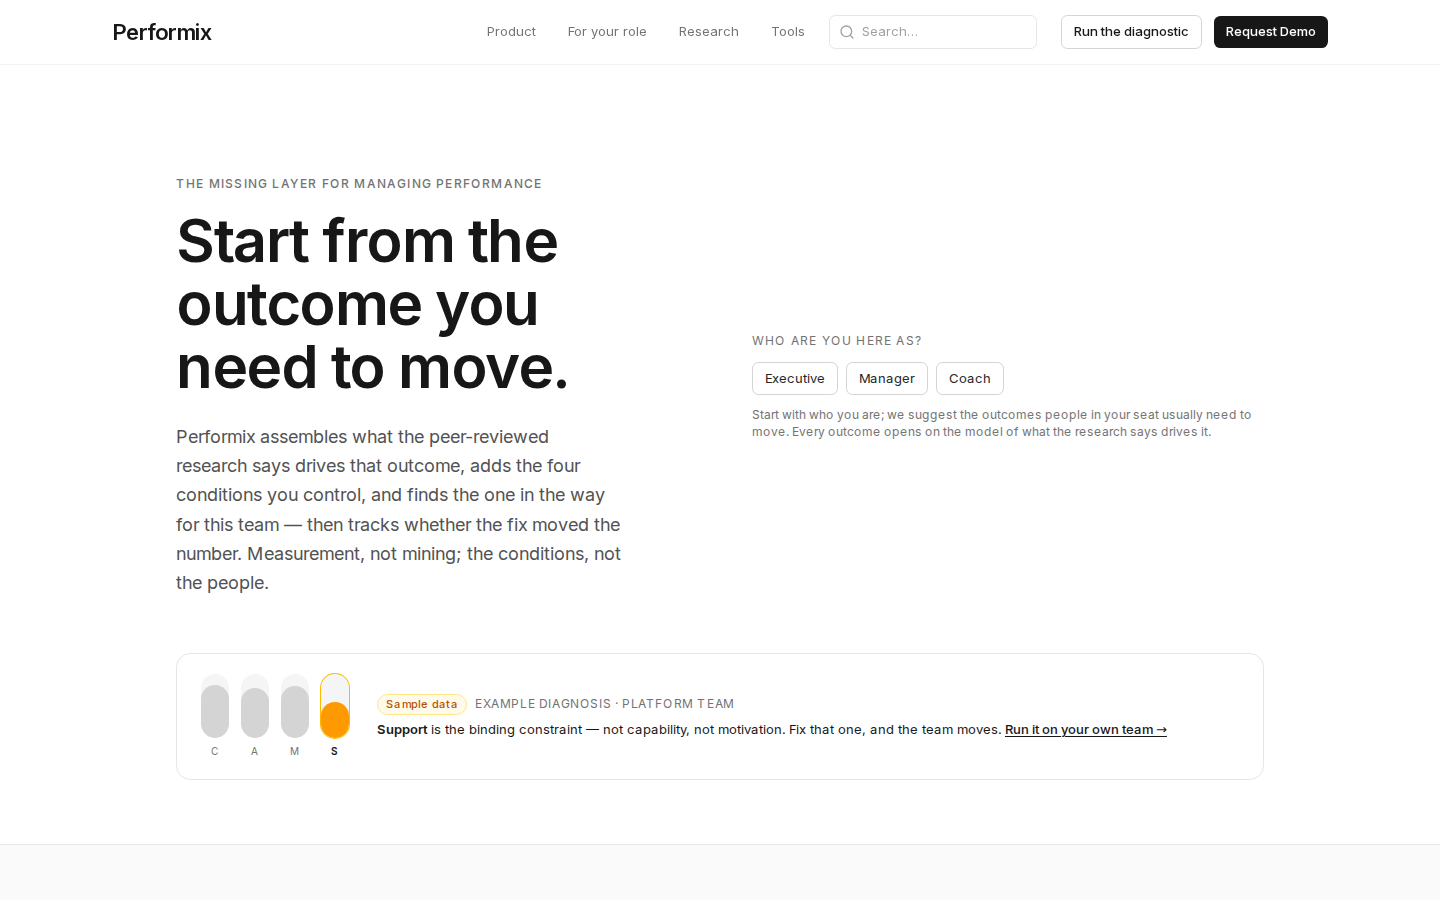
I wanted the research to come first. Performix makes the drivers and the strength of the evidence visible, then adds what the team says about capability, alignment, motivation and support. The result stays at team level because the useful question is about the conditions around the work, not a score for each person.
The practical standard is simple: show what is known, label what is still an estimate and tell the leader which measurement would reduce the uncertainty most. That gives the next decision a better basis than another dashboard or a single engagement score.
Who it is for
Performix is for sales, operations and HR leaders who own a team result and must choose what to change. It also serves coaches and people-analytics professionals who need to inspect the research, explain a diagnosis and hear what employees can safely say about their working conditions without reducing anyone to an individual score.
The problem
When quota, turnover, burnout, quality, safety or another result moves the wrong way, the dashboard shows what happened but does not name the cause. Surveys may average capability, alignment, motivation and support into one score, while HR records show transactions rather than the condition blocking the work. Employees may see the problem clearly and still doubt that they can say it safely. The leader is left choosing among training, hiring, compensation, process changes and manager coaching, with a real risk of spending on the condition that was already strong.
What I built
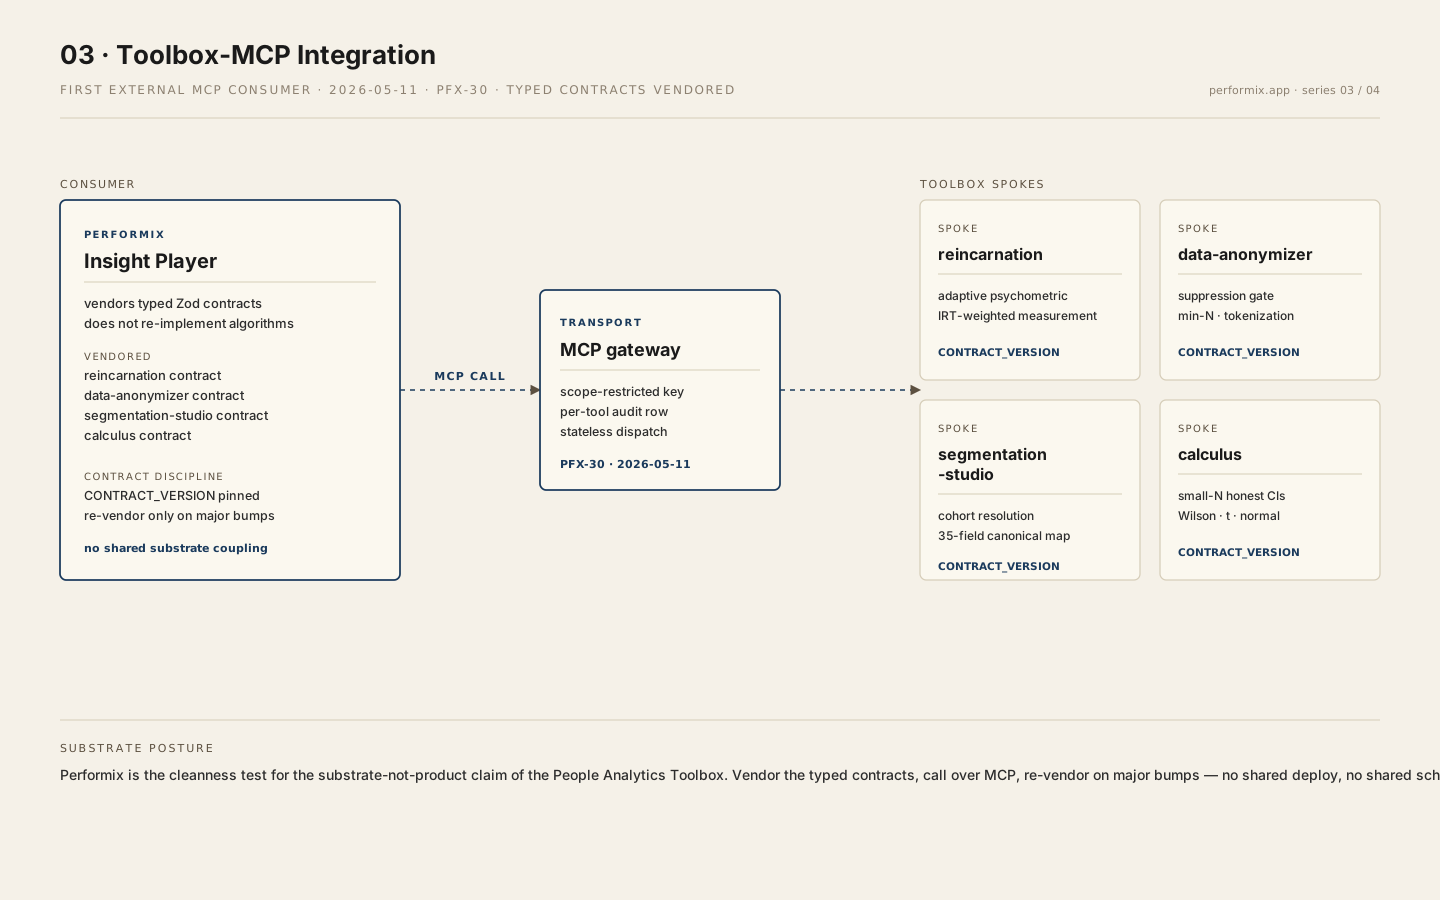
Performix combines public research models with a team diagnostic for leaders in sales, operations and HR. It covers 28 workplace outcomes through 349 driver links across 157 constructs, with each relationship graded for strength of evidence. Models open without sign-in and can be downloaded as CSV. The team measurement uses answers about shared working conditions to narrow down what is holding the team back, without watching or scoring individuals. On the signed-out sales quota model, Performix shows a likely limiting condition, an opportunity range of $80k–$140k/yr, ±30%, clearly marked “not measured yet,” and the three measurements that would add the most information. The grades and basis for the estimate remain visible, so the answer can be inspected.
What is new in it
- Performix begins with the result a leader owns, such as quota, turnover or burnout, and works back to the conditions that research connects to it. The decision stays tied to an outcome rather than a general survey score.
- Every driver relationship has an evidence grade. Stronger and thinner findings remain distinguishable within the model, and the public CSV lets an analyst inspect the same structure presented to the leader.
- The signed-out sales model labels its dollar range as “research priors + your estimates · not measured yet.” That distinction prevents an estimate from being presented as a measurement.
- For sales quota attainment, Performix ranks the three measurements that would add the most information. The leader can see what to check next and why that evidence would help.
- The team measurement examines capability, alignment, motivation and support as shared conditions around the work. It narrows the diagnosis without employee surveillance or individual scores.
Where it stands
The aim is for a leader to begin with the result, see what the research supports, hear the team safely and spend first on the condition most likely holding the work back. Performix is live with public, evidence-graded models, downloadable data and a team measurement. The signed-out sales model already shows the likely condition and the most informative measurements to take next.