Choose dashboard — Retention and Composition
- Executive
- Headcount Plan
- Retention and Composition
- Engagement and Exit
- Talent Acquisition Funnel
- Performance Calibration
- Compensation Cycle
- Compensation Structure
- Succession and Talent Ops
- Workforce Economics
- Wellbeing & retention outcomes
- Performance outcomes
- Engineering delivery outcomes
- Safety & quality outcomes
- Sales outcomes
- Service & customer experience outcomes
people analytics dashboard
Retention and Composition
Retention, tenure, turnover cost, representation, and screening views.
8 pages · Power BI
These dashboards use synthetic workforce data. Values illustrate the report design.
Selected page
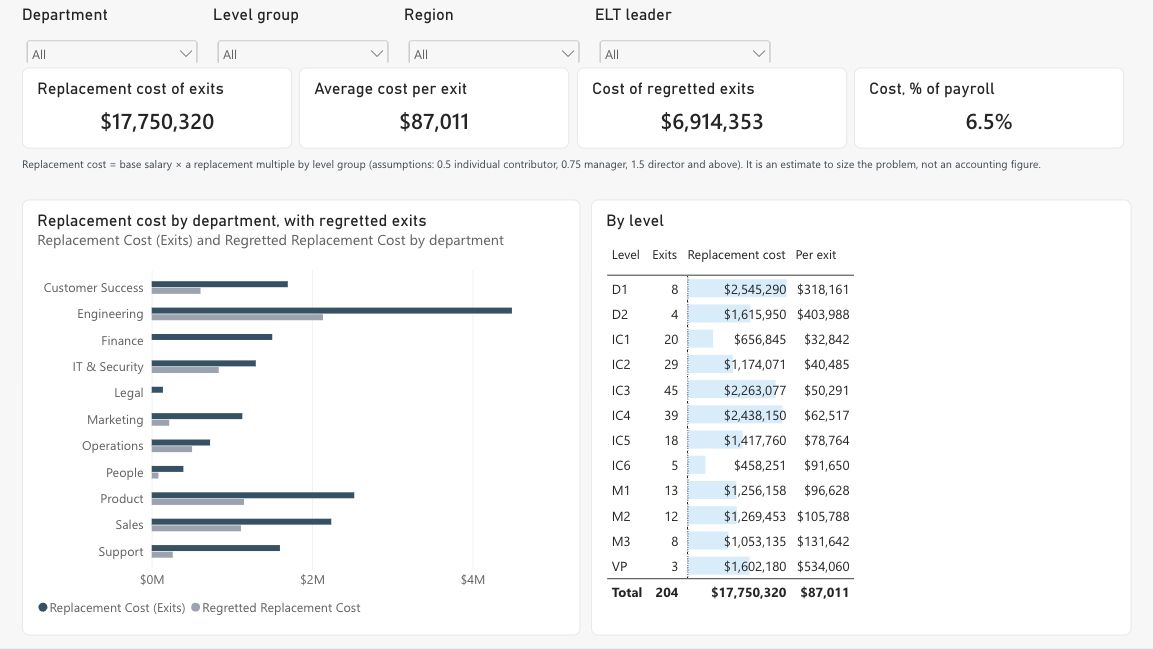
4 Turnover cost